The radar
Each point is where @AIMLPM ranks among them over the same days: the edge means no one is above. The right half is Volume, the left half is Consistency; tap either to jump to its chapter.
Tap any axis for the count behind it.
Volume
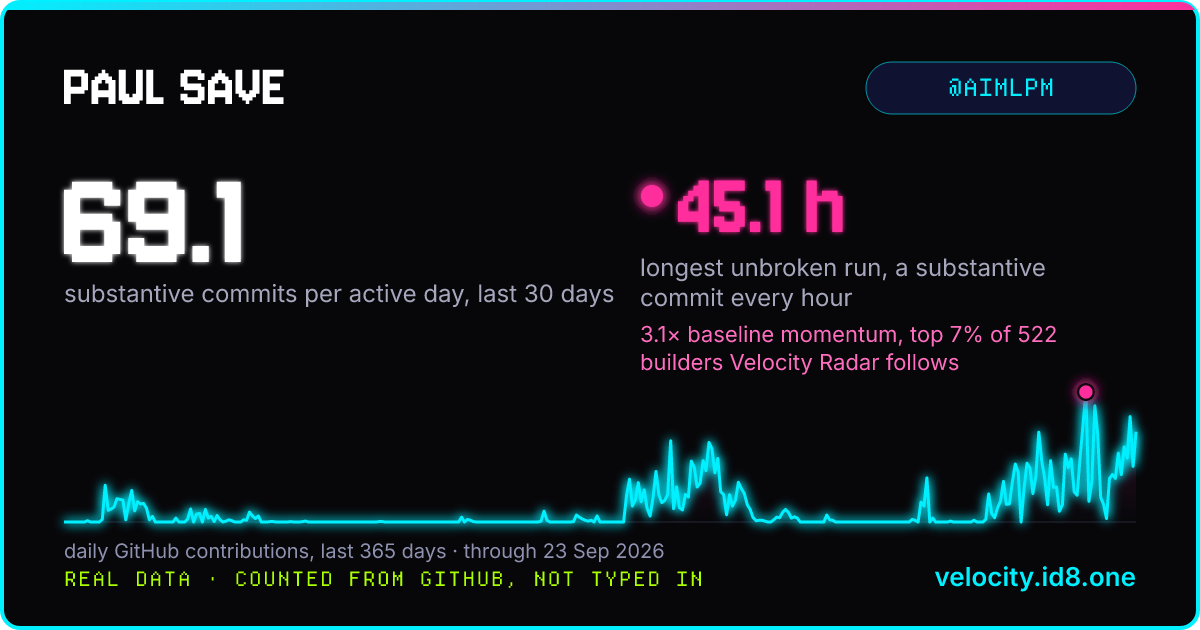
The newest stretch of 30 active days ran at 126.8 contributions a day, 3.1× their earlier pace of 40.8.
Pace, in stretches of 30 active days
GitHub recordHow it's measured
Substantive commits per active day
iD8 countedPeak day · their ten busiest days
GitHub recordConsistency
In the last 30 days, 29 were solid days (10 or more contributions) and 25 reached 50.
Every day of the year, in the radar's own tiers
GitHub recordHow it's measured
- Active day
- A day with at least one GitHub contribution: a commit, pull request, review or issue, private ones included when the profile shares them.
- Solid day
- A day with 10 or more contributions.
- 50+ day
- A day with 50 or more, drawn in the three brightest shades.
- Solid streak
- The most solid days in a row. Outlined in red.
- Active streak
- The most active days in a row. Any contribution counts, so it can run longer than the solid streak.
The shades are the same for everyone, so two people's calendars compare directly. Days are UTC calendar days.
Stamina
iD8 counted
Read from their own repositories by the iD8 count, which they ran in their GitHub account; private repositories never leave it. Only people who ran it have these figures, so they are not ranked. How the count works
The longest run with a substantive commit in every hour lasted 45.1 hours, from 18 Sep 09:52 to 20 Sep 06:58 (America/Los_Angeles).
Long days
Time of day · share of substantive commits
How it's measured
iD8 counted counted through 23 Sep 2026 · 26 repositories, 20 private · refresh your count →
Substantive means every commit they authored on a repository's default branch, except merges, automated commits (messages that start with chore, ci, release, a version number and the like) and placeholder messages such as "wip", "fix" or ".".
The record
Monthly contributions · last 24 months, public and private
Per year · and the year before the last 365 days
Size · median lines per substantive commit
What they see in their count · the run of 24 Sep 2026
The totals of their count run of 24 Sep 2026, from 26 repositories, 20 of them private.
How to read the signals
Contributions come from GitHub's own calendar: commits, pull requests, reviews and issues, as GitHub counts them. Private work is in the total when the profile shares it. Calendar days are UTC.
A change in pace says more than a total. Pace compares the newest stretch of 30 active days with the person's own earlier pace, so a jump shows when their output changed.
Public commit counts are floors. GitHub's public records break down public repositories only, so anyone with private work has done more than they show.
No private contributions is not a quiet profile. Much of the busiest work sits in companies' private repositories, and sharing private counts is each person's choice.
iD8 counted figures come from the person's own count, run in their GitHub account: every commit they authored on each repository's default branch, sorted into substantive, merge, automated and micro by the first line of its message. Private repositories are read inside their account, and their names never leave it.