VELOCITY RADARFROM iD8 Generate your radarStart

iD8 · Velocity Radar

Your GitHub stats, reimagined.How fast do you really ship?

Velocity Radar reads your record from GitHub and shows your volume, consistency and stamina, ranked against the 2,505 builders it follows. Private repositories count too, and their names never leave your account.

Free. One snippet on your GitHub profile to start; about a minute.

Tired of the same boring graphs?

GitHub shows the squares. Not what's behind them.

The green calendar counts contributions a day. It can't tell a day of real work from a day of chores, or show how long you kept going.

? How much of it was real workSubstantive commits

Merges, automated commits and one-word messages are sorted out, so what's left is the work.

? How steady you areSolid days and streaks

Every day of the year in tiers, the longest solid streak outlined, ranked against the list.

? How long you can goUnbroken runs

The longest run with a commit in every hour, hour by hour, from your own count.

The radar · live

Where you rank, on six figures.

Your snippet alone gives you this: a page at velocity.id8.one/stats/you, and a radar of where you stand among 2,505 builders, from GitHub's own calendar.

  • Volume on the right: daily average, daily intensity, and how you're trending.
  • Consistency on the left: solid days, 50+ days, and your longest streak.
  • Switch between the last 30, 90, 180 and 365 days. The edge means no one is above you.
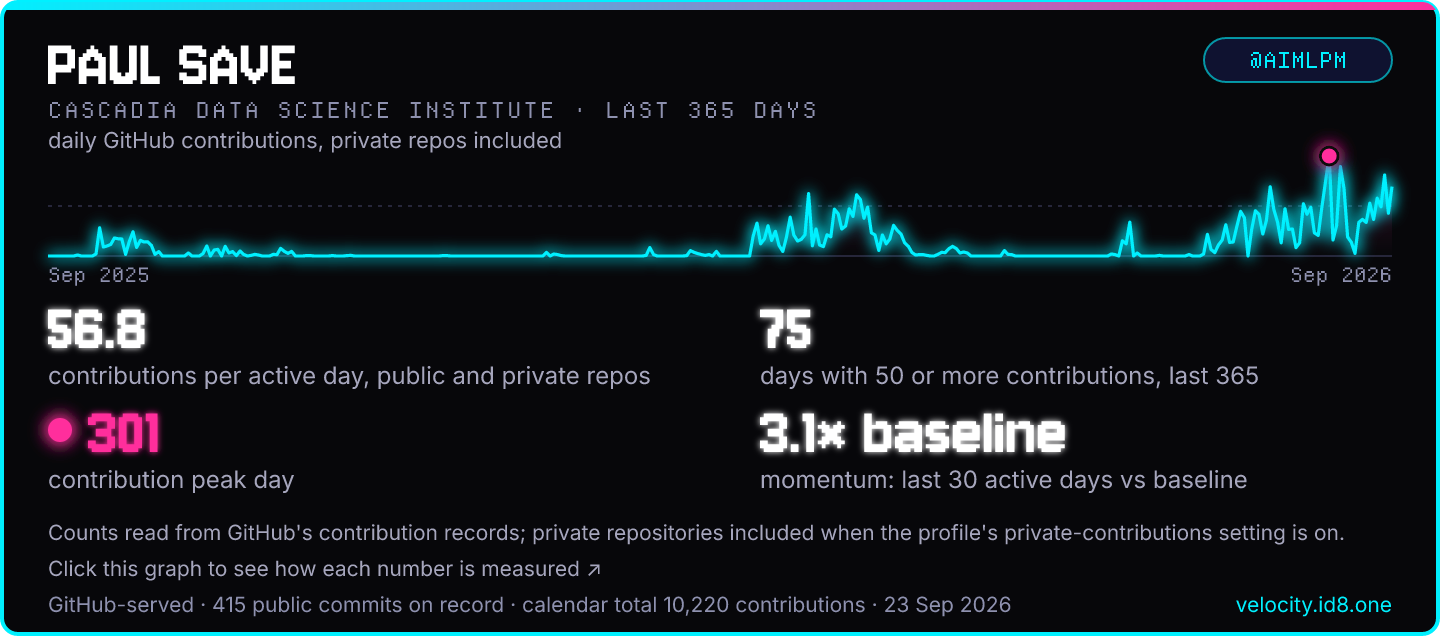
@AIMLPM's Velocity Graph in Arcade dark
The graph for your GitHub profile, in Arcade light, Arcade dark or Classic.
Contents · ranked against the 2,505 builders Velocity Radar follows

The radar

Each point is where @AIMLPM ranks, over the same days, among more than 2,500 of GitHub's most active builders, many of them leading agent-orchestration developers, so a high rank here is harder to earn than on a typical leaderboard. The outer edge of the spider chart below is first place: the elite of the elite.

The right half is Volume, the left half is Consistency; tap either to jump to its section.

CCONSISTENCY
VOLUMEV

Tap any axis for the count behind it.

last 30 dayslast 365 days▲▲ +20 or more▲ +5 to 19→ within 5▼ −5 or morerank points against the last 365 days

This is @AIMLPM's radar, live. Open their page: velocity.id8.one/stats/AIMLPM →

Stamina · from a count

Private repos included. Their names, never.

Run the count in your own GitHub account and your page's Stamina chapter lights up: your longest unbroken run, your longest stretch, and the hours of your day, worked out from every commit you made.

  • The count runs on GitHub's machines, in your account, with a read-only token that expires in 7 days.
  • It sends nothing. Velocity Radar reads the totals from your run's public log only when you press Check my run.
  • No repository names, commit messages or code ever leave your account.
Chapter 3 · beyond the radar

Stamina

iD8 counted

Read from their own repositories by the iD8 count, which they ran in their GitHub account; private repositories never leave it. Only people who ran it have these figures, so they are not ranked. How the count works

The longest run with a substantive commit in every hour lasted 75 hours, from 30 Sep 09:06 to 3 Oct 12:08 (America/Los_Angeles).

Times are @AIMLPM's local time zone (America/Los_Angeles).

substantive commits in that hourovernight, 23:00 to 07:00 (America/Los_Angeles)

Long days

Time of day · share of substantive commits

How it's measured

How it works

Three steps. Start with one.

  1. About a minute

    Add the snippet

    Paste one snippet into your GitHub profile README. Your page and radar go live at velocity.id8.one/stats/you, and your graph shows on your profile.

  2. About 10 minutes

    Run the count

    Commit one small workflow file to your profile repository and press Run workflow. It counts your commits, private repositories included, inside your own account.

  3. One press

    Check my run

    Velocity Radar reads the finished run back from GitHub, checks it is the published count, and your page lights up with your real figures.

Read from GitHub, not typed in

Nothing to take on trust.

  • The counting code is public. It's one file, pinned by its full commit id, so it can't change under you. Read count.yml.
  • The formulas are the same everywhere. Your run carries Velocity Radar's own formulas file byte for byte, with the test cases that pin it, and checks both before it counts.
  • Your token stays with GitHub. Read-only, 7 days, stored as a secret in your repository. Velocity Radar never sees it.
  • You can leave any time. Remove the snippet from your profile and your page closes after the next check.

Wait no longer.

See your GitHub stats the way they should look.